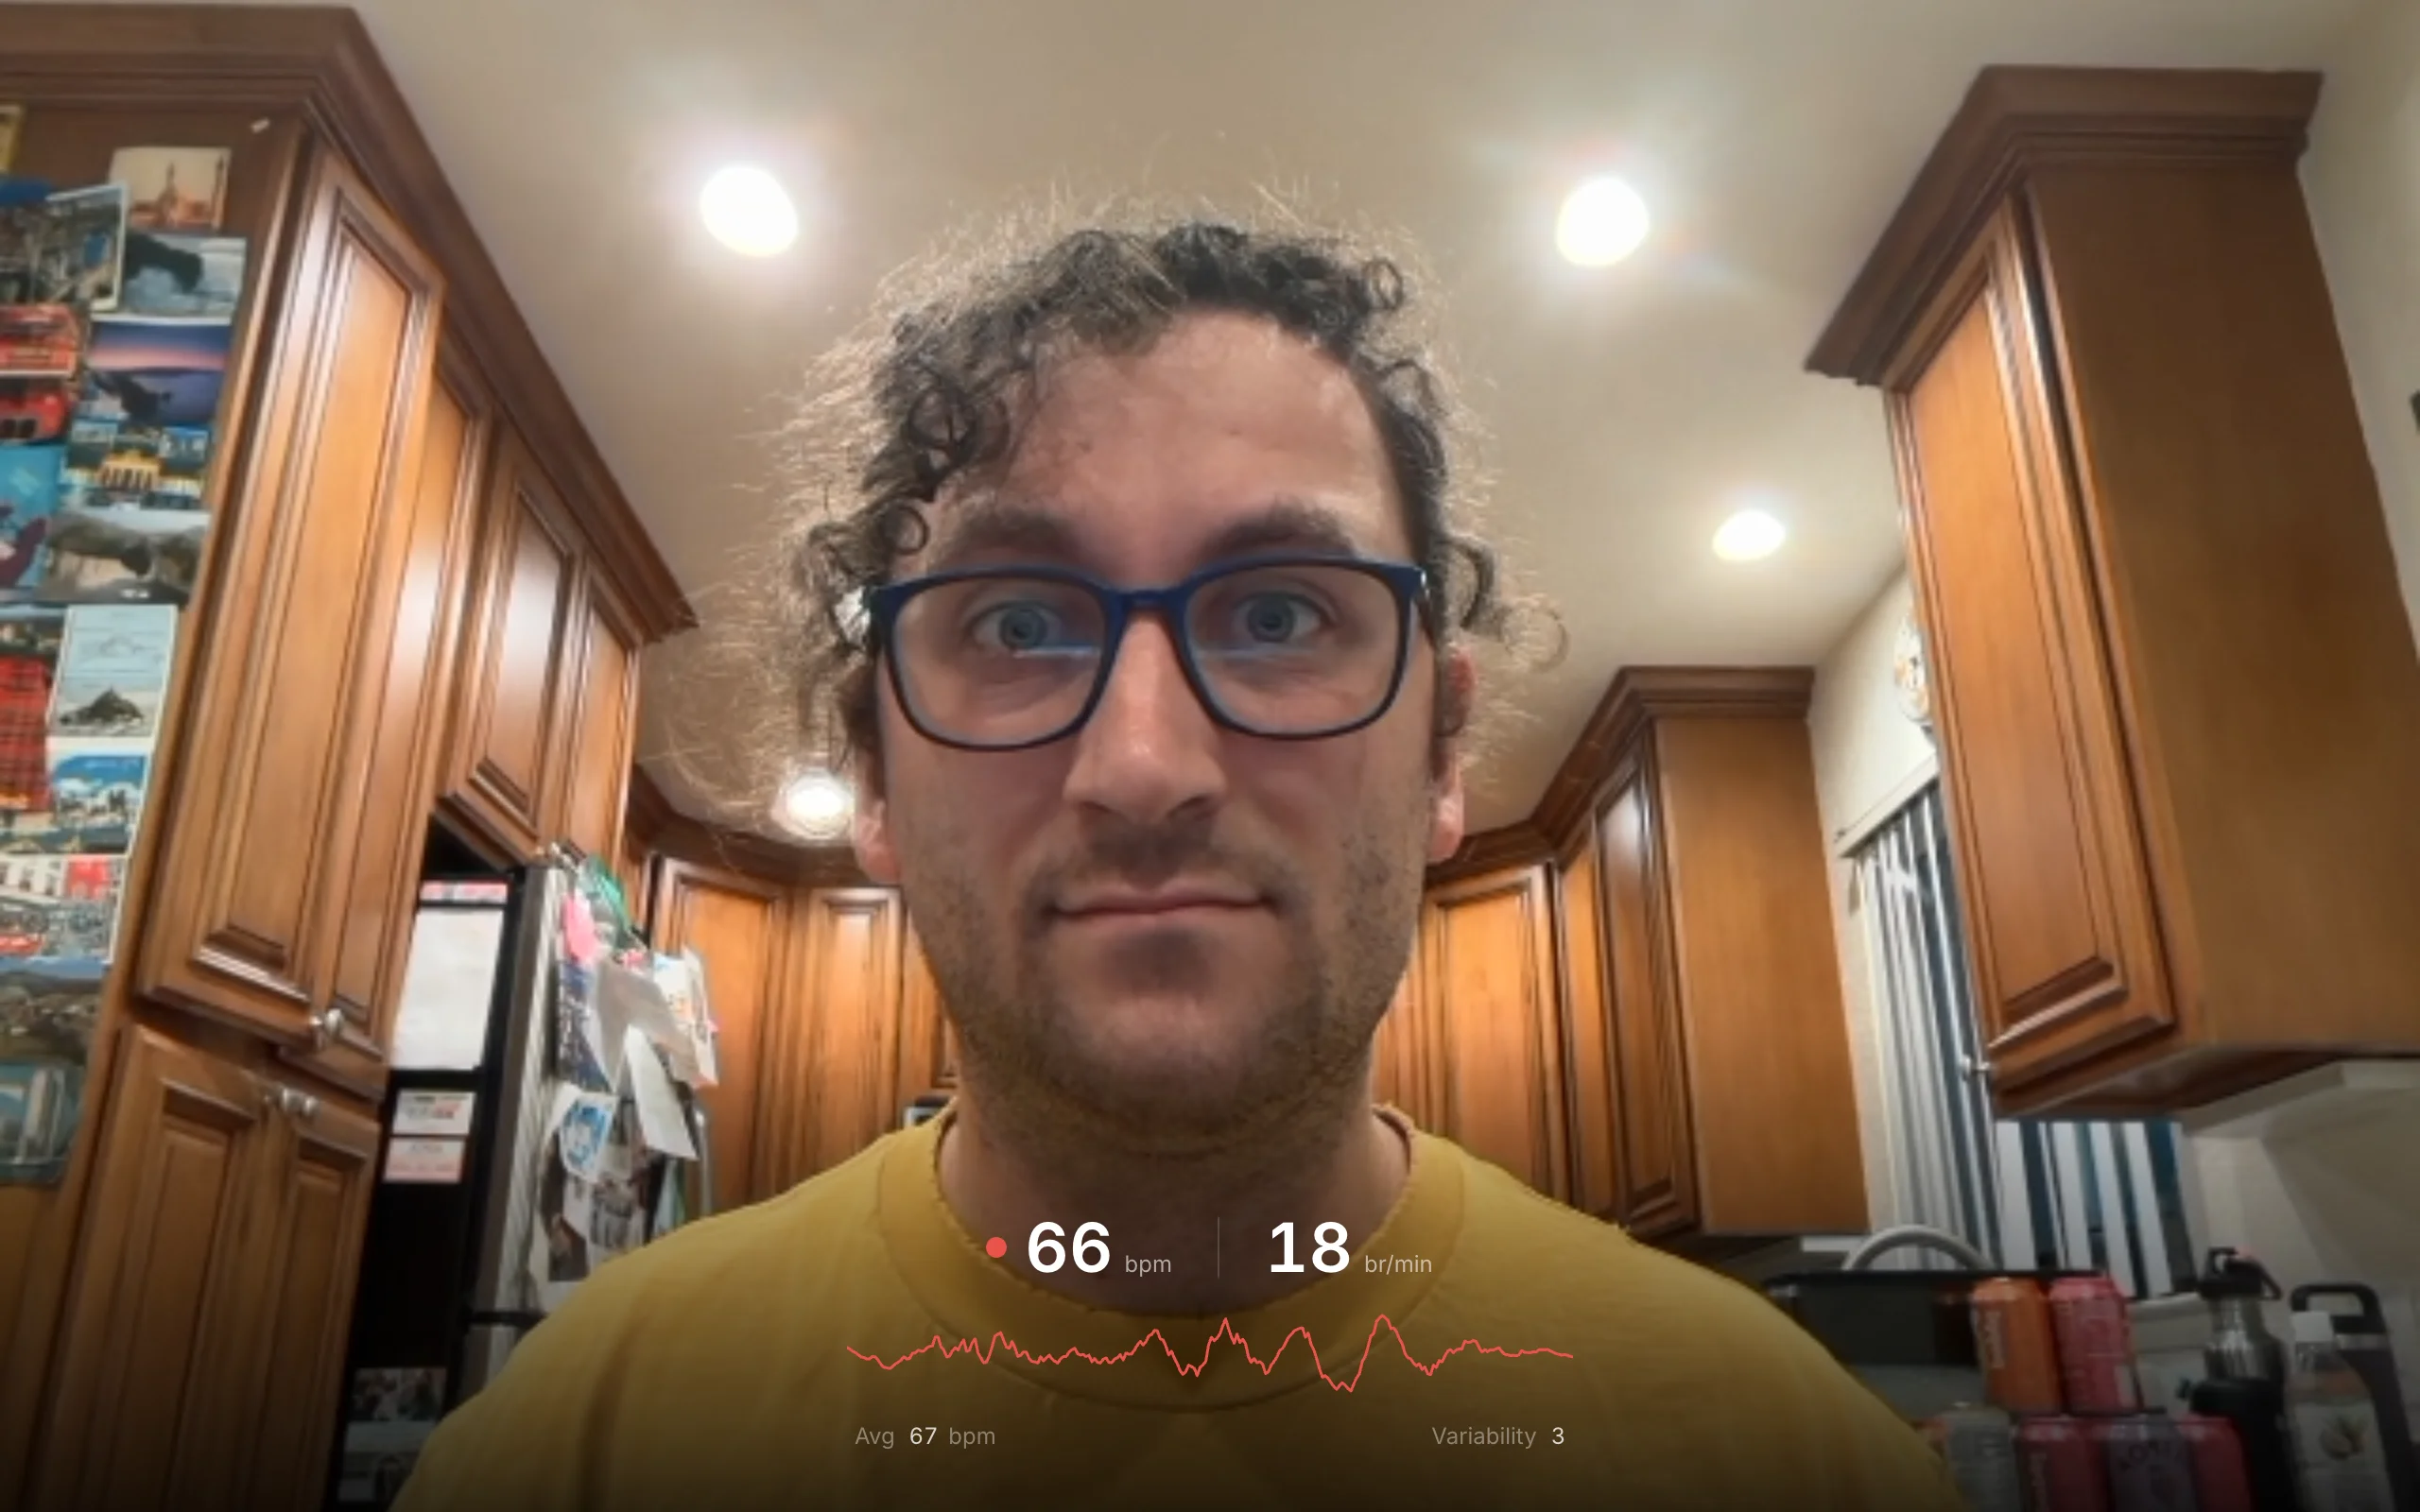
Your webcam can see your heartbeat. Each cardiac cycle pushes blood through the capillaries in your face, causing sub-pixel color fluctuations as oxygenated hemoglobin absorbs green light. These fluctuations are invisible to the naked eye but measurable in the raw pixel stream. Remote photoplethysmography (rPPG) extracts a pulse signal from these color changes, and from that signal you can derive heart rate, heart rate variability, and even breathing rate. This project does all of that in real time, entirely in the browser, with nothing but a webcam.

Face detection and ROI placement
The signal pipeline begins with MediaPipe FaceLandmarker, which provides 478 facial landmarks per frame using a float16 model running on the GPU. Three regions of interest are constructed from landmark subsets: a forehead ROI (landmarks 10, 67, 69, 104, 108, 151, 284, 298, 299, 337), a left cheek ROI (123, 147, 187, 205, 206, 216), and a right cheek ROI (352, 376, 411, 425, 426, 436). Each ROI is the axis-aligned bounding box of its landmarks, padded by 4 pixels.
Face detection runs every 3 frames to limit computational cost. Each ROI is downsampled to \(32 \times 32\) pixels, and a weighted mean of R, G, B values is computed across all pixels that pass a skin-tone classifier, with per-pixel weights provided by the spatial beamformer described below. The classifier operates in normalized chrominance space:
\[r_n = \frac{R}{R + G + B}, \qquad g_n = \frac{G}{R + G + B}\]A pixel is classified as skin if the sum \(R + G + B > 60\) and the normalized coordinates fall within \(r_n \in (0.35, 0.6)\), \(g_n \in (0.25, 0.4)\). This rejects background pixels, specular highlights, and shadowed regions before they corrupt the mean color signal.
The POS algorithm
The core pulse extraction uses the Plane Orthogonal to Skin (POS) algorithm (Wang et al., 2017), which projects temporal color variations onto a plane in normalized RGB space that is orthogonal to the skin-tone direction. This projection suppresses specular reflections and motion artifacts while preserving the blood volume pulse.
Given time series of spatially averaged color channels \(R(t)\), \(G(t)\), \(B(t)\) from the three face ROIs, the algorithm processes overlapping windows of length \(L = 48\) samples (1.6 seconds at 30 fps). Within each window starting at frame \(t_0\):
1. Temporal normalization. Each channel is divided by its window mean to remove the DC component and reduce sensitivity to skin tone and illumination:
\[\tilde{C}(t) = \frac{C(t)}{\bar{C}}, \qquad \bar{C} = \frac{1}{L}\sum_{j=0}^{L-1} C(t_0 + j), \qquad C \in \{R, G, B\}\]2. POS projection. Two signals are constructed that lie in the plane orthogonal to the skin-tone vector \([1, 1, 1]^\top\) in normalized color space:
\[S_1(t) = \tilde{G}(t) - \tilde{B}(t)\] \[S_2(t) = \tilde{G}(t) + \tilde{B}(t) - 2\tilde{R}(t)\]The first projection \(S_1\) captures the difference between green and blue channels, which is sensitive to blood volume changes (hemoglobin absorbs green light more than blue). The second projection \(S_2\) adds a correction term involving the red channel. Together, these two signals span the plane orthogonal to uniform illumination changes.
3. Adaptive combination. The two projections are combined with a data-driven weight that minimizes the contribution of non-pulse components:
\[\alpha = \frac{\sigma(S_1)}{\sigma(S_2)}\] \[H(t) = S_1(t) + \alpha \cdot S_2(t)\]The ratio of standard deviations adapts the combination to the current signal characteristics. When motion artifacts dominate \(S_2\), its standard deviation inflates and \(\alpha\) shrinks, automatically down-weighting the corrupted projection.
4. Overlap-add. The windowed pulse signal is standardized and accumulated into the output buffer with overlap averaging:
\[p(t) \mathrel{+}= \frac{H(t) - \bar{S}_1}{\max\bigl(\sigma(S_1),\, 10^{-10}\bigr)} \cdot \frac{1}{L}\]The overlap-add with \(1/L\) normalization smooths discontinuities at window boundaries and produces a continuous pulse waveform stored in a 256-sample ring buffer.
Spatial beamforming
Not all skin pixels carry the pulse signal equally. Specular highlights, shadow boundaries, and occluded regions add noise that dilutes the blood volume pulse in the spatial average. Once a heart rate estimate is available, a spatial beamformer refines the averaging by upweighting pixels whose green-channel time series correlates with the cardiac frequency.
The beamformer records the green channel of each pixel in the forehead ROI (\(32 \times 32 = 1024\) pixels) into a ring buffer of 64 frames. After a minimum of 30 frames have accumulated, it correlates each pixel's time series with a sinusoidal reference at the detected heart rate:
\[r(t) = \sin\!\left(\frac{2\pi \cdot \text{bpm}}{60 \cdot f_s} \cdot t\right)\]For each pixel \(p\), the Pearson correlation with the reference is computed from the mean-subtracted green-channel history \(\tilde{g}_p(t) = g_p(t) - \bar{g}_p\):
\[\rho_p = \frac{\sum_t \tilde{g}_p(t)\, r(t)}{\sqrt{\sum_t \tilde{g}_p(t)^2 \;\cdot\; \sum_t r(t)^2}}\]Pixels whose green channel oscillates in phase with the heartbeat produce \(\rho_p \approx 1\); pixels dominated by noise or motion artifacts produce \(\rho_p \approx 0\). The correlation is clamped to non-negative values and mapped to a weight with a floor of 0.1:
\[w_p = 0.1 + 0.9 \cdot \max(0,\, \rho_p)\]The floor ensures that no pixel is fully silenced, preserving the ability to detect rate changes even when the beamformer's reference is slightly off. The weighted spatial mean replaces the uniform mean in the POS input:
\[\bar{C} = \frac{\sum_p w_p \cdot C_p}{\sum_p w_p}, \qquad C \in \{R, G, B\}\]This creates a feedback loop: the POS algorithm produces a BPM estimate, which feeds the beamformer, which produces better pixel weights, which yield a cleaner POS signal. Before the first BPM estimate is available, all weights default to 1 (uniform averaging).
Peak detection
The raw POS signal contains the pulse but also noise, baseline drift, and harmonics. The dominant heart rate frequency is extracted through detrending, bandpass filtering, and a dual-estimator fusion that runs both FFT spectral analysis and time-domain autocorrelation in parallel.
Detrending. A moving-average filter with window size 60 is subtracted from the signal to remove slow baseline drift:
\[x_\text{detrended}(t) = x(t) - \frac{1}{|W(t)|}\sum_{j \in W(t)} x(j)\]where \(W(t)\) is the set of indices within 30 samples of \(t\), clamped to the signal boundaries.
Bandpass filtering. The signal is filtered to the heart rate frequency range \([f_\text{min}, f_\text{max}] = [0.667, 3.333]\) Hz (corresponding to 40-200 bpm). The filter is implemented in the frequency domain: the signal is zero-padded to the next power of two, transformed via FFT, all bins outside the passband are zeroed, and the inverse FFT recovers the filtered signal.
FFT estimator. A Hamming window is applied to the filtered signal:
\[w(n) = 0.54 - 0.46 \cos\!\left(\frac{2\pi n}{N - 1}\right)\]The windowed signal is zero-padded to the next power of two and transformed using a Cooley-Tukey radix-2 FFT with bit-reversal permutation. The magnitude spectrum is computed over the first half of the output:
\[|X(k)| = \sqrt{\operatorname{Re}(X_k)^2 + \operatorname{Im}(X_k)^2}, \qquad k = 0, \ldots, N/2 - 1\]The dominant peak is found by scanning the bins corresponding to the passband \([f_\text{min}, f_\text{max}]\). A noise floor rejection test requires the peak magnitude to exceed twice the median magnitude within the passband. If it passes, parabolic interpolation refines the peak location to sub-bin precision:
\[\hat{k} = k_\text{peak} + \frac{1}{2} \cdot \frac{\alpha - \gamma}{\alpha - 2\beta + \gamma}\]where \(\alpha = |X(k_\text{peak} - 1)|\), \(\beta = |X(k_\text{peak})|\), \(\gamma = |X(k_\text{peak} + 1)|\). The refined frequency is \(\hat{f} = \hat{k} \cdot f_s / N\), and the spectral confidence is the ratio of peak power to total passband power: \(c_\text{FFT} = |X(k_\text{peak})|^2 / \sum_{k \in \text{band}} |X(k)|^2\).
Autocorrelation estimator. The same bandpass-filtered signal (without windowing) is analyzed by computing the normalized autocorrelation at each lag \(\tau\) in the range \([f_s / f_\text{max},\; f_s / f_\text{min}]\):
\[R(\tau) = \frac{\sum_{t} x(t)\, x(t + \tau)}{\sum_{t} x(t)^2}\]The lag with the highest positive autocorrelation is refined via parabolic interpolation, and the frequency is \(\hat{f} = f_s / \hat{\tau}\). The autocorrelation value itself serves as the confidence \(c_\text{AC}\).
Fusion. Both estimators run on the same filtered signal and are fused by agreement. If both produce estimates that are within 10% of each other (relative to the larger), the estimates are averaged and the higher confidence is taken. If they disagree, the estimate with the higher confidence wins. This dual-estimator approach is more robust than either method alone: FFT has better frequency resolution for long signals, while autocorrelation is less sensitive to spectral leakage and harmonic confusion. Estimates with fused confidence below 0.08 are discarded.
Breathing rate estimation
Breathing rate is estimated from three independent sources, each capturing a different physical manifestation of respiration.
Chest motion. A chest ROI is placed below the face, anchored to the nose tip (landmark 1) and chin (landmark 152). Its vertical position starts 0.3 face-heights below the chin, with width 1.6 and height 1.2 times the face height. The ROI is downsampled to \(32 \times 32\) pixels, and the mean signed green-channel difference between consecutive frames is computed:
\[E(t) = \frac{1}{N_\text{px}}\sum_{i=1}^{N_\text{px}} \bigl(G_i(t) - G_i(t-1)\bigr)\]The signed mean (rather than RMS) preserves the polarity of the brightness change, avoiding frequency doubling that would occur if the signal were squared. The green channel is used because it has the highest signal-to-noise ratio for physiological signals. The motion signal oscillates at the breathing frequency as the chest rises and falls. It is processed through the same dual-estimator pipeline used for heart rate: detrend (window size 150) \(\to\) bandpass \([0.1, 0.6]\) Hz (6-36 breaths/min) \(\to\) parallel FFT (Hamming window, 4\(\times\) zero-padded) and autocorrelation \(\to\) fusion by agreement. When the two estimators agree within 10%, their frequency estimates are averaged; otherwise the higher-confidence estimate is selected. Estimates with fused confidence below 0.12 are discarded. The buffer holds 900 samples (30 seconds at 30 fps), and a minimum of 240 samples (8 seconds) is required.
Facial landmark displacement. Breathing causes subtle vertical oscillation of the face. The average \(y\)-coordinate of three MediaPipe landmarks (4: nose tip, 6: nose bridge, 152: chin) is tracked at every face detection step. The raw landmark position is smoothed with a single-pole low-pass filter (\(\alpha = 0.5\)) before buffering to reduce detection jitter, producing a time series sampled at \(30/3 = 10\) Hz. This signal undergoes the same dual-estimator pipeline (detrend, bandpass, FFT + autocorrelation fusion) with a detrend window of 50 and a minimum of 80 samples. Because the sample rate differs from the camera frame rate, the lag range and FFT frequency bins are scaled accordingly.
Respiratory sinus arrhythmia. Heart rate is not constant within a breath cycle. It accelerates during inhalation and decelerates during exhalation, a phenomenon called respiratory sinus arrhythmia (RSA). This modulation encodes the breathing frequency within the heart rate signal itself. To extract it, beat-to-beat RR intervals are computed from the peaks detected in the filtered rPPG signal (with a minimum peak distance of \(\lfloor f_s \cdot 60 / \text{BPM}_\text{max}\rfloor\) samples). Only intervals between \(60/\text{BPM}_\text{max} = 0.3\) s and \(60/\text{BPM}_\text{min} = 1.5\) s are retained. When at least 15 beats are available, the irregular RR interval series is resampled to a uniform 4 Hz tachogram via linear interpolation, then processed through an FFT-based spectral pipeline: detrend, bandpass \([0.1, 0.6]\) Hz, Hamming window, 4\(\times\) zero-padded FFT, and peak detection. (RSA uses FFT alone rather than the dual-estimator fusion, since the uniform 4 Hz resampling produces a clean, well-conditioned spectrum with sufficient frequency resolution.) The resulting confidence is discounted by a factor of 0.8 to reflect the indirect nature of RSA-derived breathing estimates.
Sensor fusion
Each measurement source produces a rate estimate with an associated confidence. Rather than averaging or taking the best, all sources are fused through a shared Kalman filter that naturally weights high-confidence measurements more heavily and provides temporal smoothing.
The state vector is \(\mathbf{x} = [x_0,\, x_1]^\top\), where \(x_0\) is the current rate (bpm or breaths/min) and \(x_1\) is its time derivative (rate of change). A constant-velocity process model predicts the state forward:
\[\mathbf{x}^- = \mathbf{F}\mathbf{x}, \qquad \mathbf{F} = \begin{bmatrix} 1 & \Delta t \\ 0 & 1 \end{bmatrix}\]The predicted covariance incorporates process noise proportional to \(\Delta t\):
\[\mathbf{P}^- = \mathbf{F}\mathbf{P}\mathbf{F}^\top + q \begin{bmatrix} \Delta t^3/3 & \Delta t^2/2 \\ \Delta t^2/2 & \Delta t \end{bmatrix}\]where \(q\) is the process noise intensity: 0.25 for heart rate, 0.06 for breathing rate. A higher \(q\) allows the filter to track faster changes in heart rate; a lower \(q\) reflects the expectation that breathing rate varies more slowly.

Each measurement \(z\) enters through the observation model \(\mathbf{H} = [1,\, 0]\) with measurement variance \(R\). The innovation (prediction error) and its variance are:
\[y = z - x_0^-, \qquad S = P_{00}^- + R\]An innovation gate rejects outliers: if \(y^2 / S > 9\) (exceeding 3\(\sigma\)), the measurement is discarded. Otherwise, the Kalman gain is computed and the state is corrected:
\[\mathbf{K} = \frac{1}{S}\begin{bmatrix} P_{00}^- \\ P_{10}^- \end{bmatrix}, \qquad \mathbf{x}^+ = \mathbf{x}^- + \mathbf{K}y, \qquad \mathbf{P}^+ = (\mathbf{I} - \mathbf{K}\mathbf{H})\mathbf{P}^-\]The measurement variance \(R\) encodes both the intrinsic noise of each source and the confidence of the current estimate:
\[R = \frac{R_0}{\max(c,\, 0.05)}\]where \(R_0\) is the base variance and \(c\) is the spectral confidence. At high confidence (\(c = 0.5\)), a heart rate measurement enters with \(R = 4/0.5 = 8\). At the confidence floor (\(c = 0.05\)), the same source enters with \(R = 80\), contributing 10\(\times\) less to the state update. The base variances by source are:
| Source | \(R_0\) | Interpretation |
| Heart rate (POS spectral) | 4 | \(\pm 2\) bpm at peak confidence |
| Breathing (landmark) | 4 | \(\pm 2\) br/min |
| Breathing (chest motion) | 20 | \(\pm 4.5\) br/min |
| Breathing (RSA) | 12 | \(\pm 3.5\) br/min |
Heart rate has a single measurement source (POS spectral peak) feeding its own Kalman filter. Breathing rate has three sources (landmark, chest motion, RSA) all feeding a shared Kalman filter, with each update weighted by the source's variance. The final output confidence is \(1 / (1 + P_{00})\), where \(P_{00}\) is the current state variance.
Motion amplification
The vital signs extracted above are invisible in the raw video feed. Motion amplification makes them visible by applying physiologically-motivated visual effects synchronized to the detected signals: a multiplicative skin flush for the cardiac cycle and geometric coordinate warping for respiration. Rather than amplifying raw per-pixel temporal variation (as in Eulerian Video Magnification), this approach drives the visualization directly from the estimated vital signals, producing cleaner output without spatial filtering.
The rendering pipeline runs in a single WebGL2 fragment shader with multiple render targets (MRT), writing six textures per frame. Double-buffered ping-pong framebuffers prevent read-write hazards. Two pairs of first-order IIR low-pass filters run per-pixel on the GPU, maintaining temporal state for the pulse band \([0.667, 3.333]\) Hz and the breathing band \([0.1, 0.6]\) Hz:
\[L_\text{new}(x, y) = L(x, y) + \alpha \bigl(I(x, y, t) - L(x, y)\bigr), \qquad \alpha = 1 - e^{-2\pi f_c / f_s}\]A smaller \(\alpha\) produces a slower-moving average (lower cutoff); a larger \(\alpha\) tracks the input more closely (higher cutoff). Two such filters with cutoffs \(f_\text{low}\) and \(f_\text{high}\) produce a temporal bandpass. These filter states are updated each frame to preserve continuity, but the amplified display is driven by the cardiac and breathing phase oscillators described below.
Dual-channel mask
A low-resolution \(80 \times 60\) mask encodes two spatial regions in separate color channels. The red channel contains two cheek ellipses, positioned relative to the nose tip at a vertical offset of \(0.15 h_f\) below the nose and a lateral offset of \(\pm 0.45 h_f\), with semi-axes \(r_x = 0.25 h_f\) and \(r_y = 0.2 h_f\) (where \(h_f\) is the distance from nose tip to chin). The green channel contains a body trapezoid anchored below the face oval: the neck (\(0.6 \times\) face width) tapers outward to the shoulders (\(2.2 \times\) face width), extending to the bottom of the frame. On the GPU, the body mask is composited to exclude the face region:
\[\text{faceMask} = M_R, \qquad \text{bodyMask} = M_G \cdot (1 - M_R)\]Cardiac flush
Once the Kalman filter has converged on a heart rate estimate, a global cardiac oscillator tracks the phase of the heartbeat:
\[\varphi(t) = \varphi(t-1) + \frac{2\pi \cdot \text{bpm} \cdot \Delta t}{60}\]The phase increment is proportional to the actual frame interval \(\Delta t\) rather than a fixed frame rate, so the oscillator stays locked to the cardiac frequency regardless of rendering jitter. Its output is gated by a blend factor that ramps smoothly as the BPM estimate stabilizes, driven by the Kalman filter's confidence \(c\):
\[\beta_\text{target} = \min(1,\; 1.5c), \qquad \beta(t) = \beta(t-1) + (\beta_\text{target} - \beta(t-1)) \cdot \min\!\left(1,\; \frac{\Delta t}{3}\right)\]If the BPM estimate is lost, \(\beta\) decays linearly to zero over 1 second: \(\beta(t) = \max(0,\, \beta(t-1) - \Delta t)\). The combined pulse signal \(s_p = \sin(\varphi) \cdot \beta\) is a scalar that oscillates at the cardiac frequency with amplitude proportional to detection confidence. On the GPU, this scalar is multiplied by the cheek mask to produce a per-pixel flush intensity, which drives a multiplicative color shift that mimics the spectral signature of hemoglobin perfusion:
\[\text{flush} = s_p \cdot \text{faceMask}\] \[\mathbf{p}_\text{out} = \mathbf{p}_\text{in} \odot \begin{bmatrix} 1 + 0.40 \cdot \text{flush} \\ 1 - 0.12 \cdot \text{flush} \\ 1 - 0.14 \cdot \text{flush} \end{bmatrix}\]The asymmetric coefficients (+40% red, -12% green, -14% blue) approximate the spectral effect of oxygenated hemoglobin: red reflectance increases during systole as blood volume peaks in the capillary bed, while green and blue reflectance decreases due to hemoglobin absorption in those bands. The multiplicative formulation preserves the underlying skin texture and shading, unlike additive approaches that wash out detail.
Respiratory displacement
The breathing visualization uses geometric coordinate warping rather than color manipulation, matching the physical nature of respiration: the upper torso expands and lifts, producing spatial displacement rather than color change. Like the cardiac flush, the effect is synthesized from a phase oscillator at the detected rate rather than driven directly from raw measurements. An earlier version warped the frame using facial-landmark vertical displacement, but that signal tracked head motion as much as breathing: jittery, one-sided, and independent of the estimated rate. Driving the display from a clean sinusoid at the fused breathing rate decouples the visual effect from frame-to-frame landmark noise.
A breathing oscillator accumulates phase at the detected rate, with the increment proportional to the actual frame interval:
\[\varphi_b(t) = \varphi_b(t-1) + \frac{2\pi \cdot \text{rate} \cdot \Delta t}{60} \pmod{2\pi}\]As with the cardiac drive, the oscillator is gated by a confidence-ramped blend factor. The target follows the breathing estimate's fused confidence \(c_b\), and the blend eases toward it over a 3-second time constant:
\[\beta_\text{target} = \min(1,\; 1.5\,c_b), \qquad \beta(t) = \beta(t-1) + \bigl(\beta_\text{target} - \beta(t-1)\bigr) \cdot \min\!\left(1,\; \frac{\Delta t}{3}\right)\]If the breathing estimate is lost, \(\beta\) decays linearly to zero over 1 second. The displayed breathing signal is the signed product \(s_b = \sin(\varphi_b) \cdot \beta\), which swings symmetrically through inhalation and exhalation rather than the previous one-sided bulge.
On the GPU, the signal drives a combined vertical lift and horizontal widen, enveloped so the motion concentrates on the upper torso while the bottom of the frame stays anchored. The envelope multiplies the body mask by a vertical smoothstep that falls off toward the lower edge of the frame:
\[\text{env} = \text{bodyMask} \cdot \text{smoothstep}(1.0,\; 0.55,\; v), \qquad b = s_b \cdot \text{env}\]The vertical lift dominates, since the shoulders rise on inhalation, and the horizontal expansion is a subtler secondary cue:
\[\text{lift} = 0.022\,b, \qquad \text{expand} = 0.05\,b\] \[(u', v') = \left(u_\text{center} + \frac{u - u_\text{center}}{1 + \text{expand}},\;\; v + \text{lift}\right)\]where \((u, v)\) are texture coordinates and \(u_\text{center}\) is the tracked body center (midpoint of the chest ROI, normalized to \([0,1]\)). Because \(s_b\) is signed, inhalation lifts and widens the shoulders while exhalation settles them back below the neutral line, producing a continuous breathing motion locked to the detected rate. The final pixel color is clamped to \([0, 1]\) after both effects are applied.
Heart rate variability
When at least 8 consecutive RR intervals are available, two time-domain HRV metrics are computed:
SDNN (standard deviation of NN intervals) measures overall variability:
\[\text{SDNN} = \sqrt{\frac{1}{n-1}\sum_{i=1}^{n}\bigl(\text{RR}_i - \overline{\text{RR}}\bigr)^2} \times 1000 \;\text{ms}\]RMSSD (root mean square of successive differences) captures short-term, beat-to-beat variability and is a marker of parasympathetic (vagal) tone:
\[\text{RMSSD} = \sqrt{\frac{1}{n-1}\sum_{i=2}^{n}\bigl(\text{RR}_i - \text{RR}_{i-1}\bigr)^2} \times 1000 \;\text{ms}\]Both metrics are converted from seconds to milliseconds and rounded to one decimal place. SDNN reflects the total power of all cyclic components acting on heart rate. RMSSD, by filtering out slow trends and retaining only successive differences, isolates the high-frequency component that is predominantly vagally mediated. A higher RMSSD generally indicates greater parasympathetic activity and cardiovascular fitness.
Implementation
The application is built with Svelte 5 and Vite, deployed to GitHub Pages. The camera captures at 640\(\times\)480 targeting 30 fps; the actual frame interval is measured from video.currentTime deltas and smoothed via an exponentially weighted moving average (\(\alpha = 0.05\)) of \(\Delta t\), then inverted to obtain the effective frame rate. Smoothing the interval rather than the reciprocal avoids the bias from Jensen's inequality (\(E[1/X] \neq 1/E[X]\)). This measured rate is used as the sample rate for all spectral analysis, and all animation timing (cardiac and breathing oscillators, blend ramps) uses per-frame \(\Delta t\) directly, so the pipeline adapts to devices that cannot sustain a constant frame rate. The main frame loop runs via requestAnimationFrame, with face detection every 3 frames and vitals computation every 60 frames. A 150-frame calibration period stabilizes the IIR filter states and allows the spatial beamformer to accumulate its initial correlation history before measurements begin. Face tracking has a 500 ms grace period before clearing ROIs on momentary detection drops. If the face is lost for more than 10 seconds, all signal buffers, filter states, beamformer weights, and the cardiac phase oscillator are reset and calibration restarts. A camera shake detector tracks the forehead ROI centroid between detection steps: the frame-to-frame displacement (in normalized coordinates) is smoothed with \(\alpha = 0.15\), and if the smoothed jitter exceeds 1.2% of the frame dimension, vital sign readouts are hidden until the camera stabilizes.
The WebGL2 renderer uses RGBA8 textures with LINEAR filtering and CLAMP_TO_EDGE wrapping. The video frame is uploaded to a texture each frame via texImage2D. All signal processing (POS, FFT, autocorrelation, peak detection, Kalman filter, spatial beamforming) runs on the main thread in pure TypeScript with Float64Array arithmetic. The FFT uses in-place Cooley-Tukey with bit-reversal permutation, and the bandpass filter operates in the frequency domain (forward FFT, zero out-of-band bins, inverse FFT). Both heart rate and breathing rate use a dual-estimator approach, running FFT spectral analysis and time-domain autocorrelation in parallel and fusing the results by agreement. No external signal processing libraries are used.